Agricultural Literacy Curriculum Matrix
Lesson Plan
Nutrients to Get Less Of (Grades 9-12)
Grade Level
Purpose
This lesson introduces sodium and sugar as dietary nutrients we should consume less of. Students will identify the foods and beverages they should limit and recognize how to use the Nutrition Facts label to measure sodium and sugar intake. Grades 9-12
Estimated Time
Materials Needed
Activity 1: Sugar in Beverages
- Assortment of beverages or beverage containers. You can also use images or photos of individual beverages with their Nutrition Facts labels. Suggested beverages to include are:
- Bottle of water
- Can of regular soda
- 20 fl. oz. bottle of regular soda
- Oversized container of soda
- 20 fl. oz. bottle of diet soda
- Coffee drink (frothed and iced, with added sugar and cream). Note: These beverages can be purchased in bottles at most grocery and convenience stores.
- Various juices (mixed vegetable juices, green juices, citrus juices)
- Energy drink
- Lemonade or iced tea drink
- Sports drink
- Chocolate-sweetened milk beverage
- Yogurt smoothie
- Milkshake
- Quart-size, resealable plastic bags
- Table sugar
- Measuring teaspoon
- Scale that measures in grams
- How Much Added Sugar is in Your Beverage? handouts, one per student
- FDA Fact Sheets:
Activity 2: Sodium in Snack Foods
- Snack Food Cards, one copy per group
- Snack food containers/packages or snack food images that show the Nutrition Facts Label.
- Table salt
- Milligram scale
- Resealable plastic bags
- Small bags measuring 2 inches x 2 inches are ideal. They can often be found at craft stores
- Sodium in Snack Foods handout, one copy per student
- FDA’s Fact Sheet: Sodium in Your Diet — Use the Nutrition Facts Label and Reduce Your Intake, one copy per student
Note: All worksheets can be downloaded as a fillable PDF.
Vocabulary
carbohydrate: an organic compound that is the main source of energy for the body; composed of carbon, oxygen, and hydrogen atoms
fiber (dietary): isolated, non-digestible carbohydrates that have beneficial physiological effects in humans
sodium: the chemical element of atomic number 11, a soft silver-white reactive metal of the alkali metal group
starch: an odorless tasteless white substance occurring widely in plant tissue and obtained chiefly from cereals and potatoes
sugar: any of the class of soluble, crystalline, typically sweet-tasting carbohydrates found in living tissues and exemplified by glucose and sucrose
Did You Know?
- Ingredients on the Nutrition Facts label are listed in descending order by weight – the closer they are to the beginning of the list, the more of that ingredient is in the food.
- Beverages such as lemonade and sports drinks usually have less sugar when compared to the same quantity of regular soda.
- Larger amounts of the same sweetened beverage have more calories, so if you want to consume a particular sweetened beverage, consider selecting a smaller container.
- Even though juices contain some nutrients, juices (even 100% juices) can contribute just as many calories to your diet as other sweetened beverages.
- Sweetened beverages like soda typically contain little or no nutrients.
Background Agricultural Connections
Understanding Carbohydrates
Carbohydrates include total sugars (naturally present and added), dietary fiber, and sugar alcohols. The Daily Value for total carbohydrates is 275 grams (based on a 2,000-calorie daily diet). Although most people consume enough carbohydrates, many people consume too much added sugars and refined starches and not enough fiber.
About Sugars
In terms of their chemical structure, sugars are the smallest and simplest type of carbohydrate. They are easily digested and absorbed by the body. There are two main types of sugars, and both types are found in many foods. Sugars that are composed of one molecule are called monosaccharides. They are small enough to be absorbed directly into the bloodstream. They include fructose, glucose, and galactose. Sugars that contain two molecules of sugar linked together are called disaccharides. They are broken down in your body into single sugars. They include:
- Sucrose (table sugar) = glucose + fructose
- Lactose (milk sugar) = glucose + galactose
- Maltose (malt sugar) = glucose + glucose
Focus on Starches
Starches are made up of many glucose molecules linked together into long chains. Starches are found naturally in foods such as vegetables (e.g., potatoes, carrots), grains (e.g., brown rice, oats, wheat, barley, corn), and beans and peas (e.g., kidney beans, garbanzo beans, lentils, split peas). Refined starches (e.g., corn starch) can be added to foods during processing or cooking as thickeners and stabilizers during processing or cooking.
About Dietary Fiber
Fiber, or dietary fiber, is a type of carbohydrate made up of many sugar molecules linked together. But unlike other carbohydrates (such as starch), dietary fiber is bound together in such a way that it cannot be readily digested in the small intestine. Dietary fiber is found in bran, whole grain foods (such as whole grain breads, cereals, pasta, and brown rice), fruits, vegetables, beans and peas, and nuts and seeds. The Dietary Guidelines for Americans recommends that at least half of total grains consumed be whole grains and that people limit refned starches and refned grains.
Naturally-Occuring Sugars
Sugars are found naturally in many nutritious foods and beverages. Naturally occurring sugars are found in a variety of foods, including:
- Fruits (fresh, frozen, dried or canned in 100% fruit juices)
- 100% fruit juices
- Dairy products
- Vegetables
Added Sugars
Added sugars are sugars added to foods and beverages during processing and preparation. Added sugars are often found in foods such as:
- Sugar-sweetened beverages, such as soft drinks, sweetened coffee and tea, energy drinks, alcoholic beverages, and flavored beverages
- Baked goods, such as cakes, cookies, pies, doughnuts, sweet rolls, and pastries
- Candy
- Dairy desserts, such as ice cream, other frozen desserts, and puddings
- Jellies, jams, syrups, and sweet toppings
What Sugars Do
Sugars provide calories and supply energy for the body. Each gram of sugar provides 4 calories. Your body breaks down sugars into glucose. Glucose in the blood (often referred to as blood sugar) is the primary energy source for your cells, tissues, and organs. Your body can use this glucose immediately, or it can store small amounts in your liver and muscles to use when needed later.
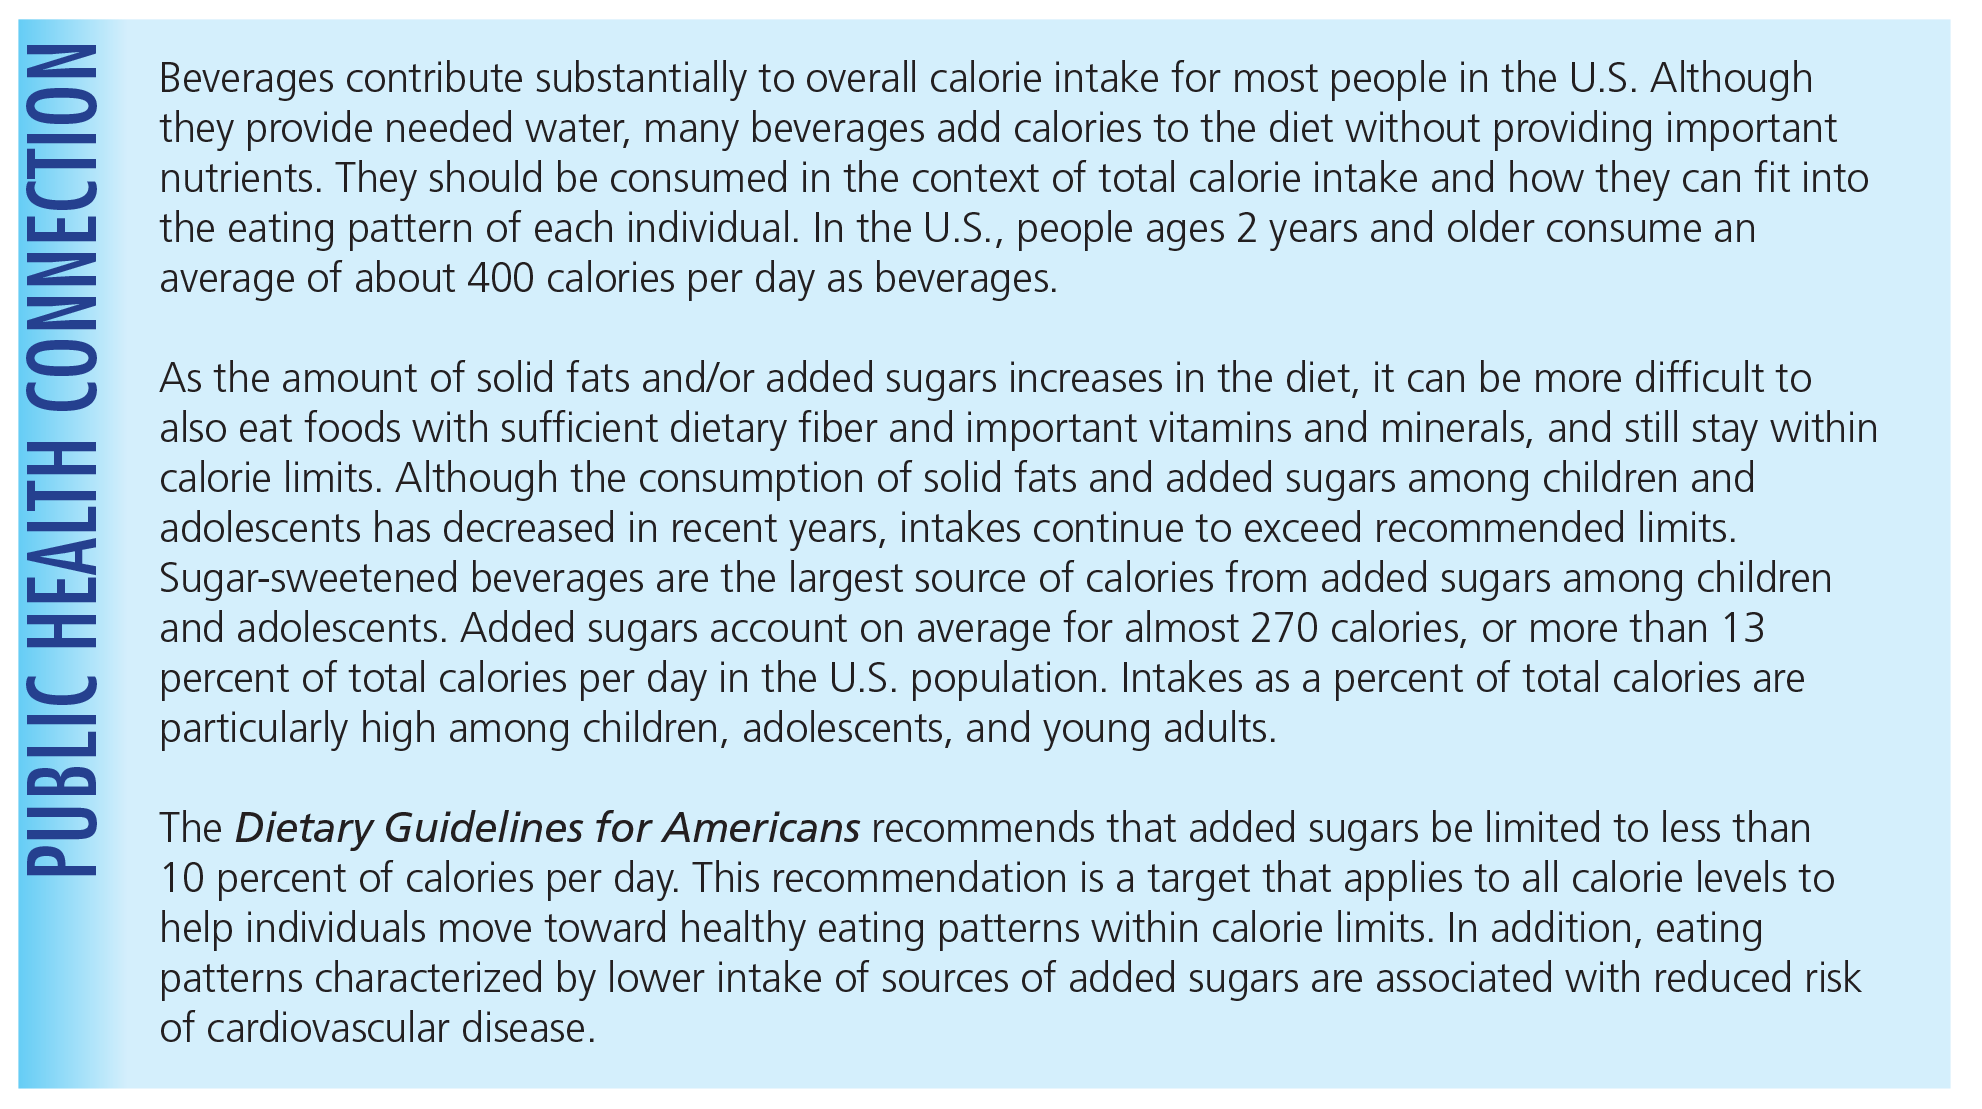
Sugars (both naturally occurring and those added to foods and beverages) increase the risk of cavities (also known as “dental caries”). In addition, consuming high levels of added sugar from products such as packaged foods and beverages can contribute to excess calories with little nutritional benefit. The Dietary Guidelines for Americans recommends limiting calories from added sugars to less than 10% of total calories per day.
Identifying Added Sugars
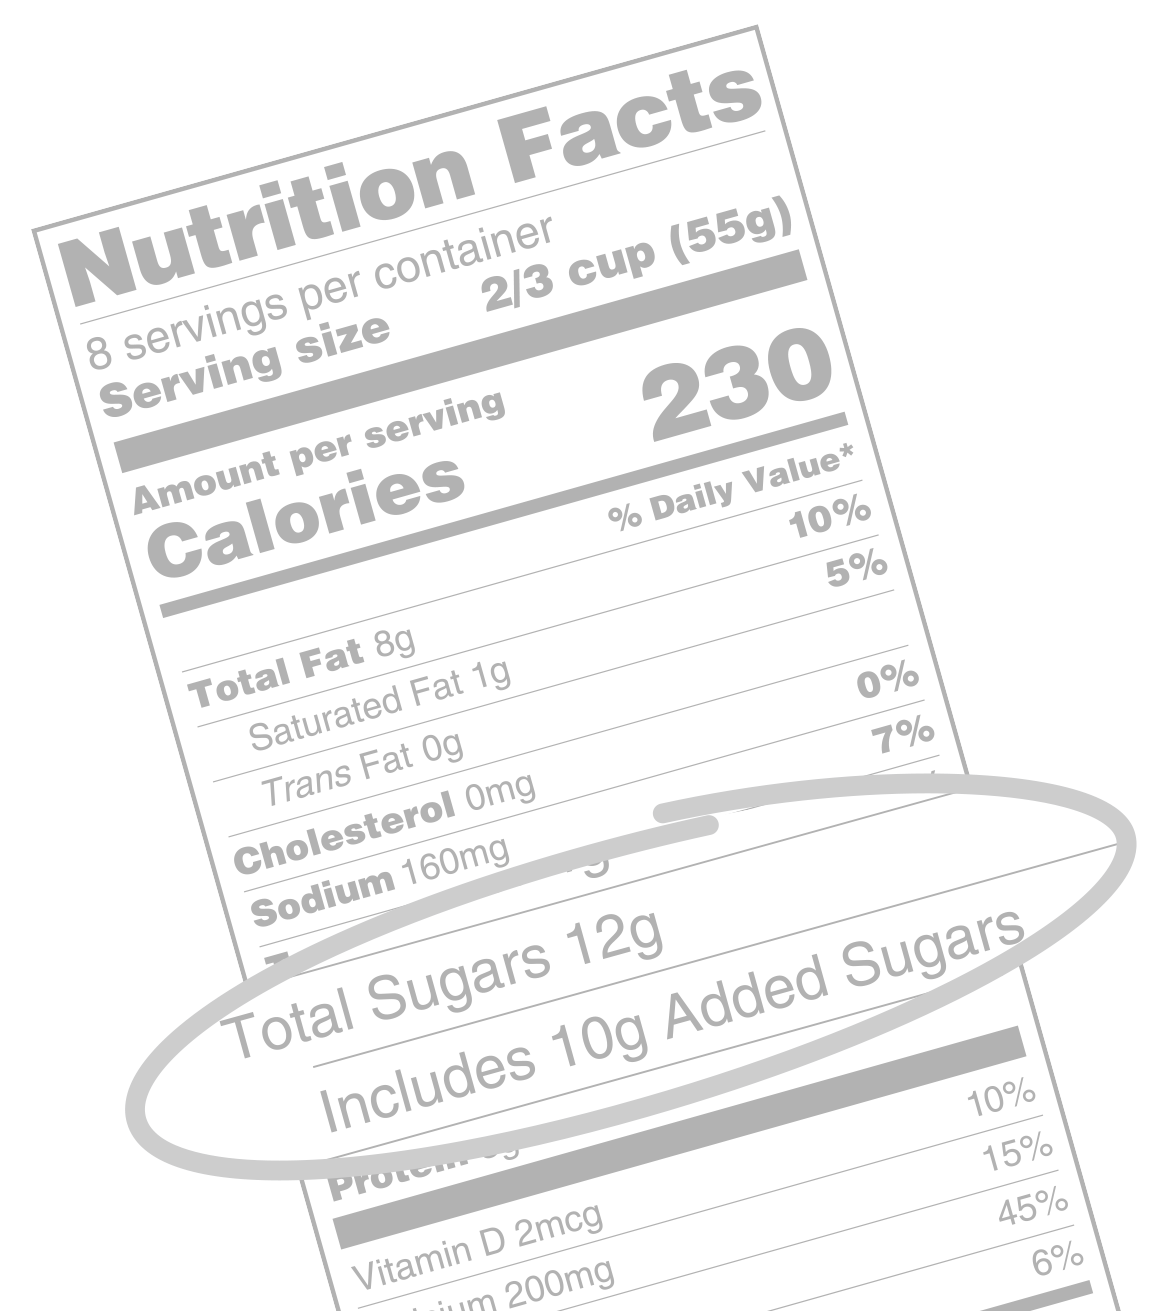
The amount of total sugars listed on the Nutrition Facts label includes those that occur naturally in the food or beverage as well as any added sugars. Added sugars are used to sweeten, preserve, or improve the functional attributes of food, such as viscosity, texture, body, color, and browning capability. Added sugars are included on the ingredient list on food and beverage packages. Some examples are: brown sugar, corn sweetener, corn syrup, dextrose, fructose sweetener, fruit juice concentrates, glucose, high fructose corn syrup, honey, invert sugar, lactose, maltose, malt syrup, maple syrup, molasses, pancake syrup, raw sugar, sucrose, trehalose, and turbinado sugar.
All About Sodium
Sodium is an essential nutrient and is needed by the human body in relatively small amounts (provided that substantial sweating does not occur). Sodium maintains a balance of body fluids, keeps muscles and nerves running smoothly, and helps certain organs work properly.
As a food ingredient, sodium has multiple uses, such as for curing meat, baking, thickening, retaining moisture, enhancing flavor (including the flavor of other ingredients, like making sweets taste sweeter), and as a preservative.
Salt and Sodium Defined
The words “salt” and “sodium” are often used interchangeably, but they do not mean the same thing. Salt (also known by its chemical name sodium chloride) is a crystal-like compound that is abundant in nature and is used to flavor and preserve food. Sodium is a mineral and one of the chemical elements found in salt.
Most people in the U.S. eat too much salt. Salt contains sodium, and too much sodium can raise blood pressure – which can have serious health consequences if not treated.
- The daily recommendation for sodium is less than 2,300 mg per day. (and less than1,800 mg per day for children ages 9 through 13).
-
Americans consume on average 3,400 milligrams (mg) of sodium per day, which is nearly 50% more than the 2,300 mg limit recommended by federal guidelines for people 14 years and older. Recommended limits for children 13 and younger are even lower.
Identifying Sodium
The Nutrition Facts label on food and beverage packages is a useful tool for making healthy dietary choices and monitoring how much sodium is in a food. Many restaurant websites also have nutrient information for their menu items.
The FDA requires nutrition information about a food that has a nutrient claim, such as “low sodium.” In addition, in the future, the FDA will require certain nutrition information, including information on sodium, on standard menu items in many restaurants and similar retail food establishments.
Most of the sodium consumed by Americans comes from the following foods:
- Deli meat sandwhiches
- Pizza
- Burritos and tacos
- Soups
- Savory snacks
- Poultry
- Pasta dishes
- Burgers
- Egg dishes and omelets
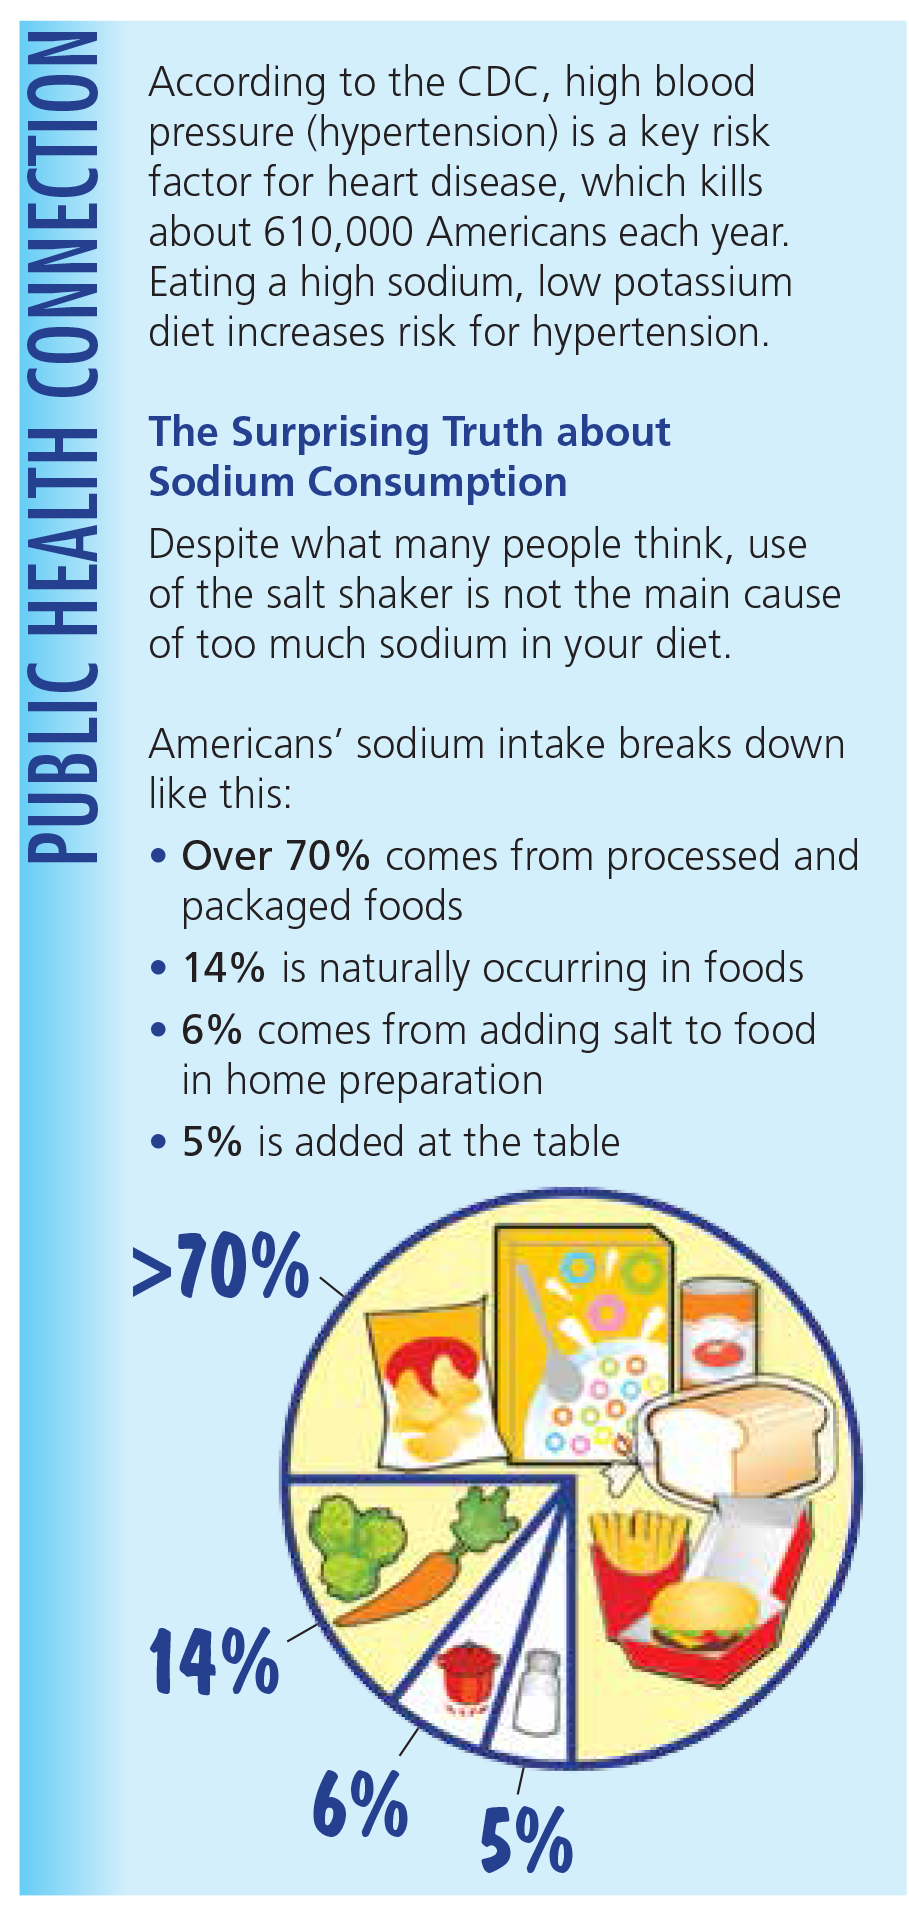
NOTE: Keep in mind that nutrition sources may vary. Although scientists don’t always agree, they must have data to support what they report. The key point to remember is that sodium comes mostly from processed foods and restaurant foods, not from what is added at the table.
Reading Food Labels for Sodium
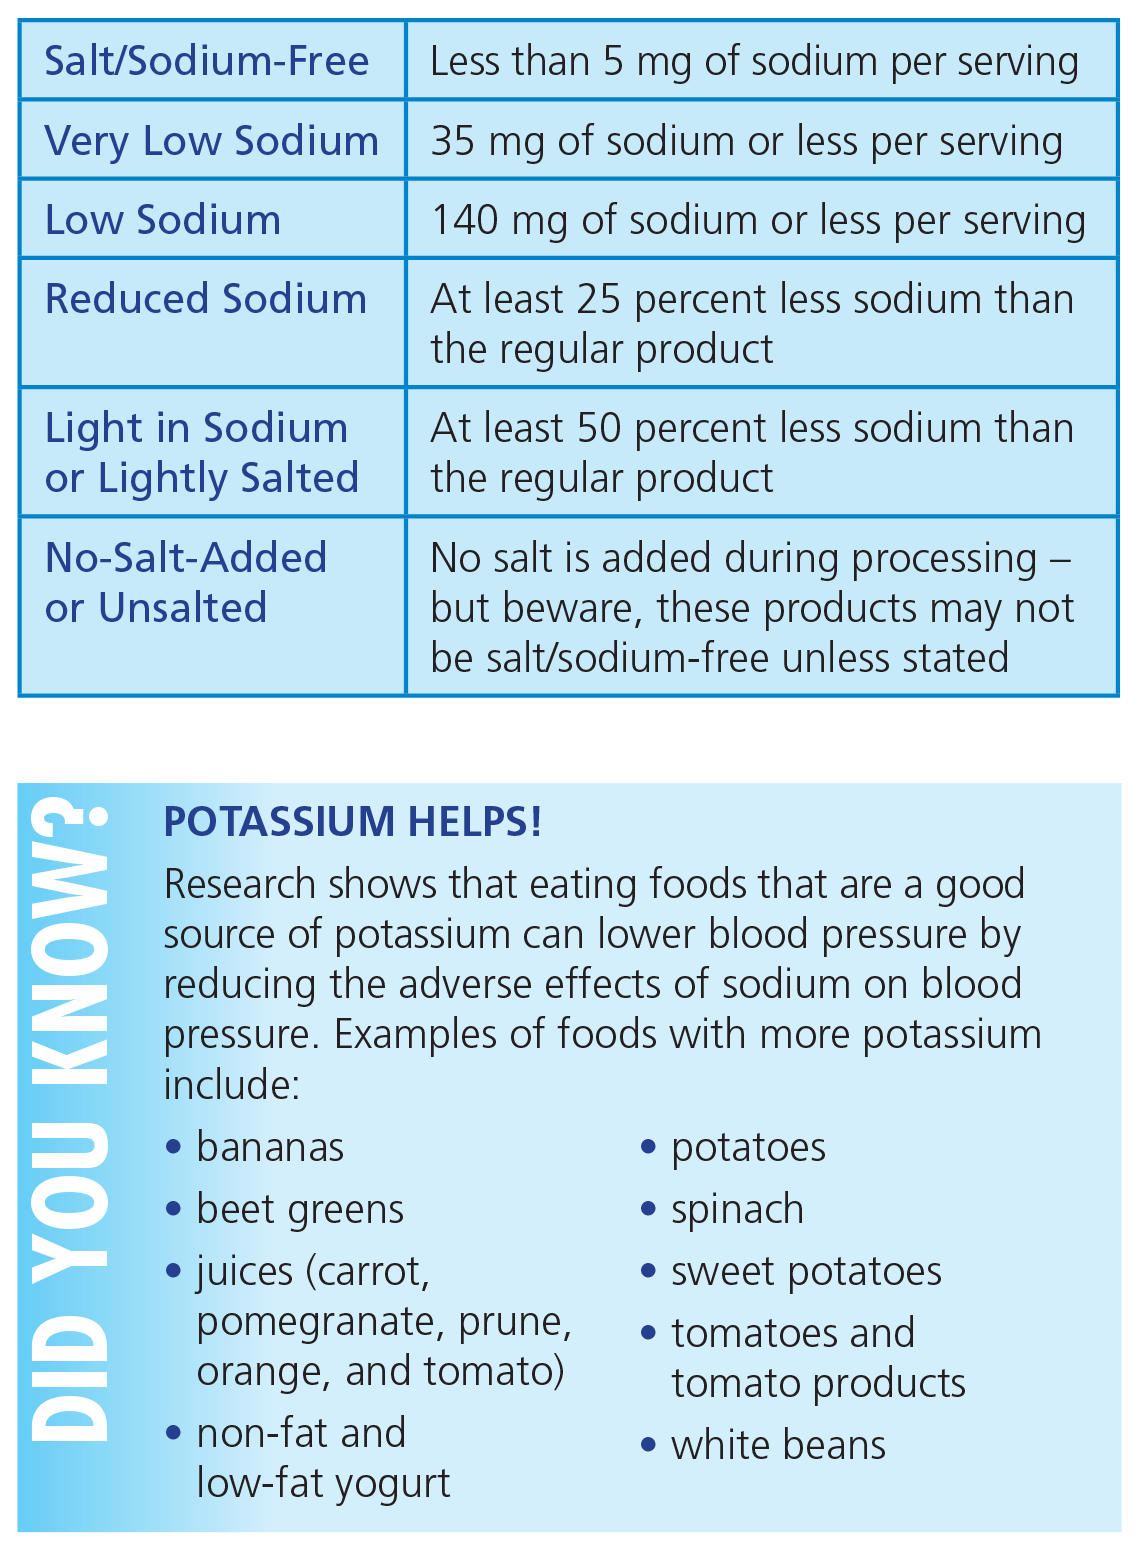
High levels of sodium may seem “hidden” in packaged food, particularly when a food doesn’t “taste” salty – but sodium is not hidden on the Nutrition Facts label! All you need to do is read the label.
- The Nutrition Facts label lists the Percent Daily Value (%DV) of sodium in one serving of a food.
- The DV for sodium is 2,300 mg, and less for people under 14 years old.
- One package of food may often contain more than one serving. So, if a package contains two servings and you eat the entire package, you have consumed twice the amount of sodium listed on the label (in other words, you’ve consumed double the %DV).
Understanding %DV for Sodium
Use the Percent Daily Value (%DV) to compare sodium in different products. The %DV tells you whether a food contributes a little or a lot to your total daily diet.
- 5% DV or less of sodium per serving is low.
- 20% DV or more of sodium per serving is high.
Engage

- Project an example food label on the board for students to see. Point out that the label indicates the nutritional content of the food contained in the package.
- Ask students if there are nutrients in our diet that should be consumed in quantities of "more" or "less." (yes)
- To pre assess student knowledge and perceptions, begin at the top of the label and work your way down asking students to give you a "thumbs up" if the nutrient should be consumed in relatively higher quantities and a "thumbs down" if the nutrient should be consumed in relatively lower quantities. For example, "Should calories be consumed in higher or lower quantities?" Then, "Should fat be consumed in higher or lower quantities?" (...continue through the label)
- Once students have indicated their prior knowledge, inform them that we will be focusing on sodium and sugar to learn why they are nutrients we should generally consume less of. If students need more
Explore and Explain
Activity 1: Sugar in Beverages
Preparation:
- Gather beverages or beverage containers for the activity. There is a wide variety of sugar-sweetened beverages on the market. Feel free to use as many or as few for this activity as you would like, but always include one sample of water and one sample of diet soda, each with 0 grams of sugar. A suggested list can be found in the Materials section. The worksheet includes space for 12 beverages.
- Create and label resealable plastic bags with corresponding amounts of sugar. For each beverage, measure sugar into a bag to represent the exact amount of sugar in the entire beverage container according to the Nutrition Facts label. (Note: The container may contain more than one serving.) To determine the number of teaspoons of sugar in each beverage:
- Find the amount of sugars on the Nutrition Facts label. Determine the number of servings in 1 container of the product and multiply the number of grams of sugars by the number of servings in each container to get the total amount of sugars per container.
- There are 4.2 grams of sugar in 1 teaspoon. Divide the grams of sugar calculated in step a above by 4.2 to determine the number of teaspoons of sugar in the beverage container.
- Note: If you have a gram scale, you can weigh out precisely the number of grams of sugar (same as the grams of carbohydrates for most products), and place the sugar in separate resealable plastic bags.
- Measure out the number of teaspoons (or grams) of sugar in each beverage with a household teaspoon measure (or scale) and place in separate resealable plastic bags.
- Label each bag of sugar with a letter that corresponds with a corresponding numbered beverage container.
- Print one copy of the attached How Much Added Sugar is in Your Beverage? handout for each student.
Activity:
- Ask students, "What are your favorite beverages?" Keep a list of your student's suggestions. Introduce this activity by explaining that you will be looking at the added sugars in beverages. Explain that the amount of Total Sugars on a Nutrition Facts label includes both the sugars that are naturally present in the beverage plus sugars added during the processing of the beverage. Review your beverage list and identify which ones you think are high or low in added sugars. Discuss student ideas with the class.
- Watch, Added Sugar on the Food Label.
- Watch, Hy-Vee KidsFit at Home – Rethink Your Drink.
- Now that students have some background information about added sugars in beverages, do an activity to help them visualize how much added sugar is in various beverages. Look at a variety of beverage containers/images and at bags that contain amounts of sugar that correspond with the amount of added sugars in each of those beverage containers. Students will determine which of the bags of sugar they think represents the amount of Added Sugars in each beverage.
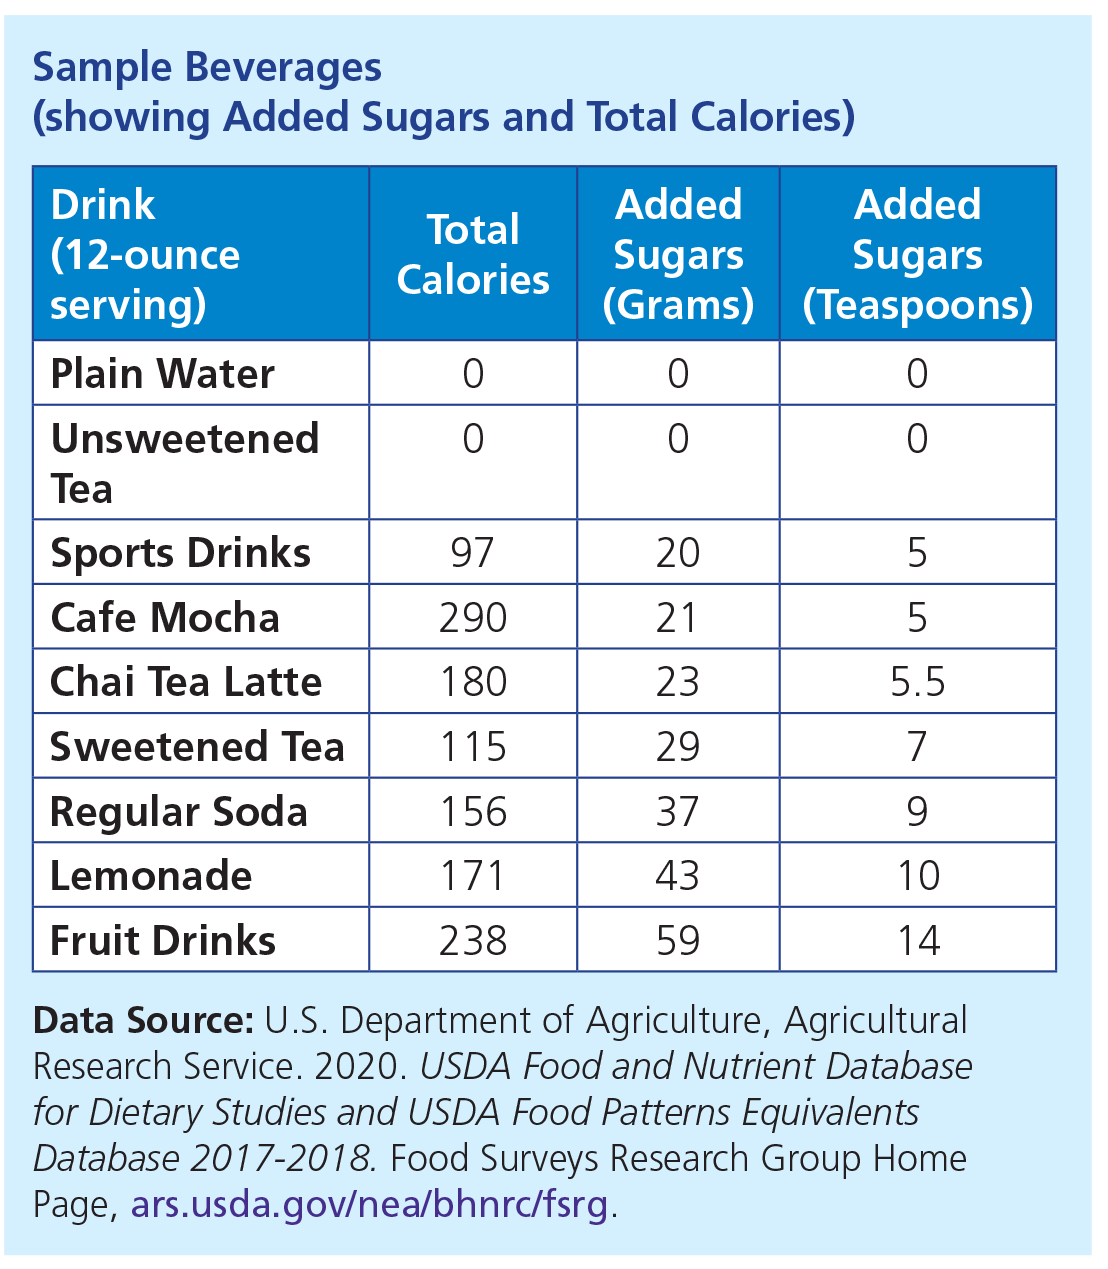 Write the name of each beverage in the left column of the data table. Select the bag of sugar that represents the amount of Added Sugars you think are in the beverage and record the letter on that bag in the column labeled: Sugar Bag.
- When all groups have finished matching their beverages with sugar bags, discuss the results on your data table with the class.
- Look at the Nutrition Facts labels for each beverage to see the grams of Total Sugars and Added Sugars on the labels. Record this information on your data table. Correct any wrong answers on your sheet.
- Which beverages had the most Added Sugars?
- Which findings surprised your group the most?
- In which beverages were the amounts of Total Sugars and Added Sugars the same?
- Assign students to read the Total and Added Sugars and Total Carbohydrates Fact Sheets and review the previous videos, Added Sugar on the Food Label and Hy-Vee KidsFit at Home – Rethink Your Drink, to answer the questions on the worksheet.
- When all groups have completed their responses to the questions, review the answers as a class.
Activity 2: Sodium in Snack Foods
Preparation:
 Gather snack food packages/containers or images of snack foods that show the Nutrition Facts labels. The snack food examples in this activity are based on a single serving.
- Banana (7 – 7.9 inches long); contains 1 mg sodium
- Diet soda (12 ounce can); contains 40 mg sodium
- Baked potato chips (1 ounce bag); contains 160 mg sodium
- Regular potato chips (1 ounce bag); contains 170 mg sodium
- Crunchy cheese snack (1 ounce bag); contains 250 mg sodium
- Large fries (5.3 ounces); contains 400 mg sodium
- Pretzels (1 ounce bag); contains 450 mg sodium
- Vegetable juice (11.5 ounce can); contains 920 mg sodium
- Sunfower seeds, kernels with salt on shells (1 ounce); contains 1,910 mg sodium
- Also include: Recommended limit for sodium per day for those 14 and older: 2,300 mg
- Average American intake of sodium per day: 3,440 mg
- Amount of sodium needed by body per day: 1,500 mg
- In this activity, table salt represents the amount of sodium in one serving of a snack or in an item that relates to sodium in a person’s diet. To prepare resealable bags for each of the items: write the number of milligrams of sodium for each item on a bag. Use a milligram scale to measure the number of milligrams of sodium (salt) for each item and add the salt to one of the bags. Prepare a set of salt bags for each group of students.
- Use USDA’s FoodData Central website to find information on the Nutrition Facts label.
- Prepare a set of Snack Food Cards and print a Sodium in Snack Foods worksheet for each group of students.
- Divide class into small groups of 2 or 3.
Activity:
- Watch the video, Sodium on the Food Label.
- Have students read the FDA Fact Sheet, Sodium in Your Diet; and answer the questions on the worksheet.
- Look at the Nutrition Facts label on the first page of the Sodium in Your Diet Fact Sheet. Ask students how much sodium is in the food represented on the label? Can they visualize what 430 milligrams might look like? A measuring teaspoon of salt has a mass of 2,300 milligrams (mg).
- Savory snacks were listed on the Sodium in Your Diet Fact Sheet as one of the food categories that contributes to about 40% of the sodium you eat. Make a list of your favorite snacks. Share your list with the rest of the class. Circle the snacks you think contain the most sodium. Remember that a snack does not need to taste salty to contain a lot of sodium.
- Give each group of students a set of Snack Food Cards that contain pictures of snacks, or information about the amount of sodium in a person’s diet. You will also have a set of bags of salt that represent the amount of sodium in the item on the cards. Challenge the students to match the picture on the card with the bag you think contains the amount of salt in each picture on the cards. When your group has finished matching all of the pictures with the corresponding salt bags, record the name of the item in the column labeled Our Answer on the Sodium in Snack Foods Data Table. When everyone has completed matching their salt bags with the pictures on the cards, review your answers with the class. If you had any incorrect responses, replace them with the correct answer on the data table.
- When all of the groups have recorded the correct matches, complete the questions on your worksheet. You can review the video, Sodium on the Food Label (from Step 1) and the Sodium in Your Diet Fact Sheet for help with the answers.
- Watch the video, Eating Too Much Salt? 4 Ways to Cut Back…Gradually and answer the question on the worksheet.
- Ask students to look at their original list of snacks and discuss which would be the most healthy and why.
Elaborate
-
Keep a beverage diary.
-
Have students create posters to advertise healthy beverage choices.
-
Review advertisements and packaging for beverages; identify marketing strategies and their influences on our choices.
-
Incorporate math into the activity for exploration of additional nutrients (beyond just sugar):
- Identify other nutrients in the beverages and calculate the percent of daily recommended intake of these nutrients.
- Foster the discussion: Many students have something to drink in place of other snacks, and even a meal in some cases. Ask your students if they drink anything that is more nutrient-dense than options with “empty” calories. As an exercise, students could compare and contrast desired nutrients, such as protein, calcium, and vitamins, in beverages with varying nutrient density.
-
As an alternative activity, or in coordination with the sodium activity, have the students look at the saturated fat (grams) and the number of calories in each of the snack foods. The students could then use these three sets of data to determine the most nutrient-dense foods (healthy snacks). One way the students could do this would be to rank the foods from lowest to highest in the amount of sodium; then with the number of calories; and finally, with the saturated fat. For example, students can look at one sample of vegetable juice with 70 calories, no fat, and 677 mg of sodium (28% DV). This would not be a good choice. If they were to consider a banana (with 105 calories, 1 mg of sodium, and 0 grams of saturated fat), then this would be a better choice. Use the data gathered in Activity 2.
-
Show the video clip, Your Food is Trying to Tell You Something!
Evaluate
Many people don’t take into consideration the amount of added sugars they consume when they drink sugary beverages because the sugar is not visible. This activity provided a strong visual illustration (bags of sugar) of the amount of added sugars in various beverages. When students become aware of the sugar in beverages, they can make better beverage choices.
Sodium is an essential nutrient; Americans often get too much sodium by eating too much salt (sodium chloride). People should be mindful of their sodium intake to preserve a healthy heart and optimal health. We should read labels for the amount of sodium in the foods we eat and try to eat foods that are low in sodium.
After conducting these activities, review and summarize the following key concepts:
- Food labels help determine specific foods that meet nutritional needs or exceed recommended daily allowances.
- Sodium and sugar are nutrients that should be monitored and not consumed in excess for a healthy diet.
Acknowledgements
The Science and Our Food Supply: Using the Nutrition Facts Label to Make Healthy Food Choices (2022 Edition) was brought to you by the Food and Drug Administration Center for Food Safety and Applied Nutrition.
Recommended Companion Resources
Author
Organization
| We welcome your feedback! If you have a question about this lesson or would like to report a broken link, please send us an email at [email protected]. If you have used this lesson and are willing to share your experience, we will provide you with a coupon code for 10% off your next purchase at AgClassroomStore. |
